
A Systematic Process of Data Collection – Condition Monitoring, A Closer Look
Condition Monitoring – A Closer Look
By Jesús R. Sifonte
Condition Monitoring is a broad term referring to the systematic process of data collection for the evaluation of asset’s performance, reliability and maintenance needs with the purpose of planning repair works. Its main purpose is Potential Failures finding. It requires the collection of good asset’s health data which trending is studied. The primary advantage of Condition Monitoring is that it incorporates health indicator monitoring activities performed while the machine is operating. Assets failures are predicted well in advance of their occurrence. It allows for planning repairs safely and economically for the plant. Also, machine parameter data trending allows extending assets operation as close as possible to their actual useful life. Condition Monitoring data provides vital information for taking important decisions affecting plant operation goals. Maintenance decisions are taken based on the actual asset condition avoiding unnecessary repairs leading to start up failures. Catastrophic failures of a critical assets presenting accelerated wear trends can be avoided by using C tasks too. Sometimes operating conditions changes causing components life expectance to reduce as noted by steeper indicators trends leading to unexpected catastrophic failures. This can be detected by CM and earlier planned shutdowns can avoid such disasters.
Condition Monitoring – A Closer Look
Maintenance people commonly refer to Condition Monitoring simply as Predictive Maintenance. But, it is certainly much more than that. Condition monitoring includes all Predictive Maintenance, Process Parameters Monitoring and Non-Destructive Testing tasks. Condition Monitoring relies on measurement and trending of asset data for predicting failure at their very early stages. While most measurements are numerical in nature (Temperature, Pressure, Amps, Ohms, Vibration, PH, etc), there exist descriptive parameters (Hi-Med-Lo, Red-Yellow-Green, Left-Center-Right) too. Trending of failure pertinent parameters (either values or conditions) is the key for successful CM application. Therefor absolute values are not as relevant as an increasing (or decreasing) trend in CM.
Studies conducted by the aviation industry in the 1970’s showed that most failure modes of non-structural components occur randomly. Consequently, T (time based restoration or replacement) tasks are rather inefficient to avoid their occurrence. It was also discovered that T tasks often induced failures demonstrating there was no relationship between age or service life of the asset and their pm task frequency or duration. A failure can provide some early warning signs during their development denoted as a potential failure. A potential failure condition is identified when an operator or maintainer detects for the first time a performance level loss as compared with the system’ s inherent or initial capabilities. C (Condition Base) tasks are suitable for finding potential failures if a pertinent parameter related to the function loss of the asset is selected and trended. When the Weibull analysis yields Beta values between 1 and 3, as shown earlier, the physics of the failure is confirmed to have a combination of random and wear out failures. This is the ideal scenario for Condition Monitoring.
RCM and Condition Monitoring
RCM-R® analysis produces decisions, many of which require the use of condition monitoring tasks. When examining standard RCM decision diagrams, it is noted that C tasks are considered as the first choice of failure management policy regardless of the Failure Cause Consequence Type. Why is that? The left column in Figure #1 shows the 4 possible Failure Consequence Management Polices (H-Hidden, S-Safety, P-Production, M-Maintenance). The following (3rd) columns show T as the second task type priority for all Policies and so forth. C tasks are always considered first and chosen as long as they are technically feasible and worth doing. Indeed, it is very common to see that about 4 to 8 C type tasks or even more are recommended for every T task in an RCM analysis report. The first Standard RCM project performed back in 1968 yielded about 85% reduction in PM time for the Boeing 747 aircraft as compared to its 707 predecessors. One of the main reasons for the PM time reduction was due to the unprecedented proliferation of C tasks in the “747” maintenance plan.

Figure #1 – General Standard RCM Decision Diagram
Condition Monitoring Data Collection and Integrity
CM is effective only if the monitored parameter can detect the intended specific failure mode with sufficient time before functional failure occurrence. For example: Air Pressure Drop measured across an air handling unit filter bank can be directly related to its performance loss. Also, this parameter is useful to determine well in advance when the filters must be replaced. But, how about inconsistent data? What if the Pressure Differential Manometer or Transmitter is not reading ok? Even more, what if the readings are taken at different fan shaft speed? Data collection repeatability is a key aspect of CM. The lack of data collection standard procedures in conjunction with little technical knowledge of the task performer and the use of unreliable (out of calibration) or wrong instruments lead to incorrect diagnostics causing bad decision making. Therefore, data collection should be performed similarly every time. Effective CM procedures clearly establishes the asset operating parameters, the correct sensor positioning and the unique instrument set up that constitute standard data collection conditions.
Data Trending and Alarm Setting
Trending makes sense once asset health parameter indicators and their corresponding standard data collection conditions have been properly chosen and established respectively. Reliability Engineering math tools enable calculation of appropriate C task frequencies. Several variables such as C task cost, PF interval, MTBF, Failure costs, Planned Correction Cost, among others are considered for calculating precise C task intervals. This information can be drawn from RCM and Weibull Analysis sheets. As a rule of thumb, when no RCM or Reliability analysis data is available, C task frequencies can be set at equal or smaller than 1/3 of the PF intervals.
Normally, most CM programs gather hundreds and even thousands of measurement points periodically. Therefore, it is imperative that alarms be set up to filter out assets needing immediate attention. It is impossible for technicians or engineers to manually analyze every data point and make diagnosis for all equipment being monitored. Alarms must be set up timely and correctly before undesirable failures occur. There are many methods for deciding alarm levels depending on the CM monitoring technique and task applied to detect potential failures for assets. Nevertheless, alert and failure level alarms should be established whenever possible. Figure #2 shows an alert alarm dot representing a parameter value between the P and the F performance levels. That is, no alarming is made at the potential failure performance level. However, an alert alarm is flagged when a performance level corresponding to either half or one third of PF time interval is reached. The failure alarm should be set up at the Functional Failure performance level meaning the asset should be stopped and repaired. Figure #2 shows that an alert alarm was set at a performance level of about 800 GPM for which around a third of PF time is still available for a planned corrective action.

Figure #2 – PF Curve with Alarms
Condition Monitoring – Predictive Maintenance Techniques
Predictive Maintenance entails the use of specific technology and techniques for applying Condition Monitoring. The main technologies used for Predictive Maintenance include:
• Vibration Analysis
• Infrared Thermography
• Structure and Airborne Ultrasound
• Oil Analysis
• Others
Each technology can cover many different techniques tailoring distinct failure mode types. The use of a specific technique can depend on the detectability of the failure mode. For example, overall vibration values may be useful for detecting dust incrustation in a cement plant oven blower. However, early detection of fan bearing wear may be possible with a more sophisticated vibration analysis technique such as High Frequency Demodulation. While both failure modes use Vibration Analysis, different vibration techniques are needed for their early identification.
Vibration Analysis
Machine vibration analysis is the study of the behavior of rotating machinery for detecting
faults based on monitoring and trending vibration signals produced by its components. All rotating machinery, whether it is in good or bad condition, will vibrate. A vibration analysis can help us determine whether the machinery vibration is normal or not. It may even detect many faults early enough to plan repairs at a convenient moment, avoiding costly plant shutdowns. The purpose of vibration analysis within the predictive maintenance context is to determine the machine’ s health while it is operating.
There are various types and levels of vibration analyses requiring varying degrees of expertise to apply correctly. Overall vibration analyses, for example, only require an overall vibration meter (usually a pen-type meter) and little training, while spectral analyses need sophisticated and more expensive fast Fourier transform (FFT) analyzers, demanding a lot of expertise from the analysts to interpret the outputs. The more sophisticated spectral analysis is capable of pinpointing vibration sources (machine internal components) precisely, while the overall
analysis can only measure the sum of all the vibration produced by the machine in the 10–1000 Hz range. It is often related to the overall condition of the machine. Overall vibration tells you there is a problem; spectral analysis tells you what the problem is. A vibration time waveform is converted into a spectrum through the FFT process. The vibration spectrum is an amplitude versus frequency graph, making possible the identification of complex machinery vibration.
Spectral vibration analysis is capable of detecting many faults at fairly early stages in their development and without disrupting machine operation. This makes vibration analysis a truly valuable CBM technique. It is commonly used to avoid unnecessary time-based repairs or changes. It helps us to avoid reducing the useful life of components that otherwise might be changed preventively and to avoid inducing premature failures. Some of the most common conditions diagnosed with spectral vibration analysis are
• Rotor imbalance and eccentricity
• Shaft misalignment and bent shafts
• Mechanical looseness
• Antifriction and journal bearing wear
• Electrically induced faults
• Gear problems
• Flow-induced problems (cavitation, turbulence, blade wear)
• Belt wear
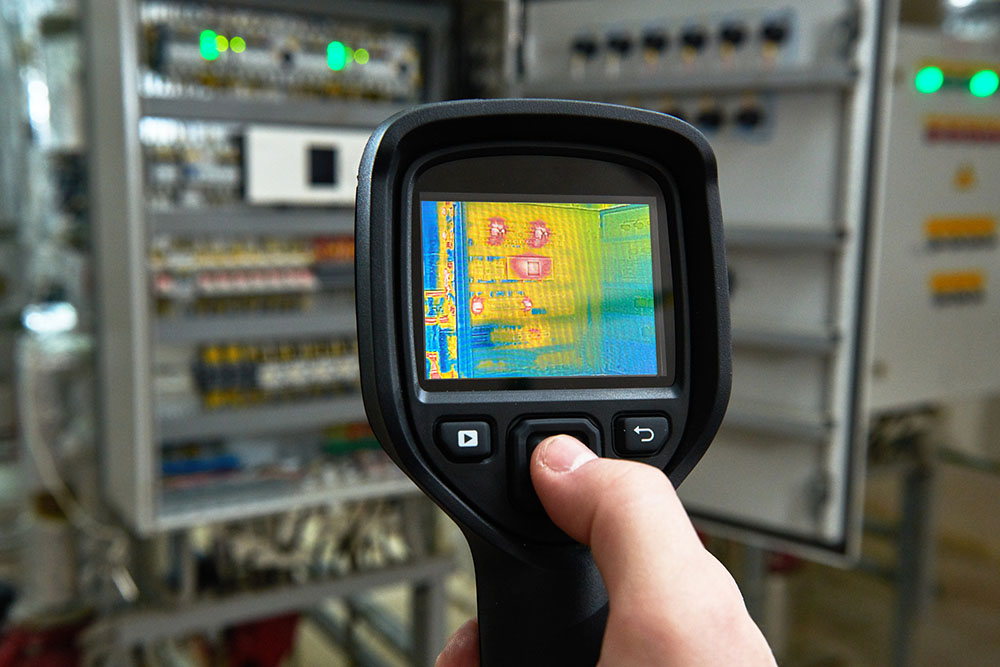
Infrared Thermography
Infrared thermography is the viewing, analyzing, and saving of an infrared image (or thermogram) with an infrared imaging device. If there is no image, then it is not thermography. The first law of infrared thermography states that infrared instruments see ONLY the radiated energy from the first 1/1000 of an inch of the surface of most solids and liquids. They do not see temperature, and they do not measure temperature. Once the infrared device measures the radiated energy, its computer will calculate the temperature using the Stefan– Boltzmann relationship.
There are four main areas where infrared thermography is valuable in any PdM program and each of them detects specific failure modes:
• Electrical equipment CBM
o Overtightened connections
o Oxidized or dirty connection
o Improper components or materials
o Poor workmanship
o Looseness
• Mechanical equipment CBM
o Bearing heating
o Coupling Misalignment
o Gearbox Overheating
o Rubbing Shaft
• Process equipment CBM
o Oven refractory thickness estimation
o Blocked or restricted flow in pipes
o Failed valves and traps
o fluid and sludge levels in tanks
• Facility CBM
o Missing insulation or damaged insulation
o Water ingress
o Air infiltration
o Air exfiltration
o Leakage in hot water heating systems
o Flat roof leaks
Ultrasound
Ultrasound is any sound pressure wave with a repetition frequency higher than 20,000 Hz. The frequencies most suitable for asset health monitoring and reliability of machine systems lie between 30,000 and 40,000 Hz. Ultrasound detectors are used to quantify or measure high frequency sound thru heterodyning. When a high-frequency soundwave is heterodyned to an audible sound wave, the quality and characteristics of the original signal are maintained. Ultrasound detectors equip humans with the ability to hear ultrasound.
Ultrasound allows maintenance and reliability to hear above the noise of the factory floor. By screening out low-frequency sounds, inspectors hear sounds consistent with machine system defects. These defects produce ultrasound from three phenomena:
• Friction (F)
• Impacts (I)
• Turbulence (T)
Failure modes increasing friction, developing any kind of mechanical impact and producing turbulence can be detected with ultrasound. Many common failure modes are assessed by less effective techniques causing increased asset downtime and energy losses. These failure modes can be detected with the use of variety of ultrasound instruments and techniques:
• Air leaks
• Valve internal leaks
• Defective steam traps
• Bearing Wear
• Electrical arching
• Pump cavitation
• Reciprocating compressor defective valves
• Heat exchanger leaks
Oil Analysis
Oil analysis measures lubricant health and condition. It is an excellent complement to other CBM tools such as vibration analysis and thermography. At its core, oil analysis does more than just measure the condition of the oil; it proactively helps to measure the level of particles, moisture, or other contaminants that are present; it helps to predict the early onset of machine wear, including failure modes that are not directly tied to lubrication; and it helps to ensure that the base oil and additives contained within the oil are still healthy and that the lubricant is good for continued use. To maximize the benefits of oil analysis, sampling frequencies, sampling locations, and test slate selections should all be tied back to the most common failure modes identified through the failure mode, effects and criticality analysis (FMECA) phase of an RCM-R® analysis. These failure modes can be detected with the use of variety of oil analysis techniques:
• Wear of internal components of rotating equipment (such as bearings, rings, shafts, etc.)
• Oil contamination
• Moisture in lubricant
• Additives depletion
• Wrong lubricant selection
• Etc.
Condition Monitoring – Process Parameters Monitoring
Assets used in industrial processes have defined operating contexts specified by their users or owners. The operating context is a statement clearly delineating the environment the assets are intended to operate in as well as an overall description of how and where they are going to be operated. Performance levels (often referred to as the performance standard) are another piece of information of vital importance for RCM-R® analysis. The performance standard defines what level of performance the user wants or needs the asset to achieve. It is those standards that RCM-R® will use in considering whether or not any particular function has reached a point of failure. Thus, the operating context and performance standards define the
asset’ s functions.
Monitoring process parameters entails measurement and trending quantitative or qualitative variables evidencing asset’s health. Pump flow, discharge pressure and fluid temperature are common process parameters of a cooling water system. The system’s owner has established their performance level and monitoring them will ensure maintenance is applied when needed to restore initial capabilities before failure. There are four commonly measured variables which affect chemical and physical processes: pressure, temperature, level and flow. PH, conductivity and moisture content, among others, are frequently monitored too. Process monitoring often reveal failure symptoms that can be related to specific failure modes. For example, low water flow measurements can be associated to a clogged pump inlet filter or strainer. A major advantages of process parameter monitoring is that sophisticated training or acquisition of expensive portable data analyzers are not required since the instrumentation to do so is embedded in the asset most of the time. Process parameter monitoring entail about 85% of all Condition Monitoring tasks.
Condition Monitoring – Non-Destructive Testing
Nondestructive testing or non-destructive testing (NDT) entails the use of a wide group of analysis techniques in science and industry to evaluate the properties of a material, component or system without causing damage. Most of the time NDT techniques, unlike process parameters monitoring or predictive maintenance techniques, cannot be applied with the asset in operation. Though NDT is often intrusive it provides us with another suite of tools in our CBM arsenal. NDT is helpful for failure identifying mechanisms such as corrosion, erosion, rupture from bursting, and external forces. The integrity of assets such as piping, vessels, tanks, boilers, and many others is predicted and protected with NDT. In addition to the application of other CBM techniques, NDT is a key program that directly impacts your health, safety, and profitability and the environment you work and live in.
Many failures start as tiny flaws undetectable to the naked eye alone. There are a multitude of techniques used to conduct NDT for flaw detection. These methods include visual testing, liquid penetrant inspections, and magnetic particle, hardness, and ultrasonic testing.
There are various conventional NDT methods targeting specific failure modes:
• Visual testing (microscope, borescope, endoscope, high-speed cameras)
o Surface anomalies
• Magnetic particle
o Surface crack
• Liquid penetrant inspection
o Surface crack detection
• Radiography
o Internal flaws
• Pulse-echo ultrasonic testing (UT)
o Material thickness loss
o Corrosion
o Cracks
In addition to the conventional NDT methods, there are also several advanced tools and technologies, including UT crack detection and sizing, C-scan corrosion mapping and flaw detection, time of flight diffraction.
Related Posts